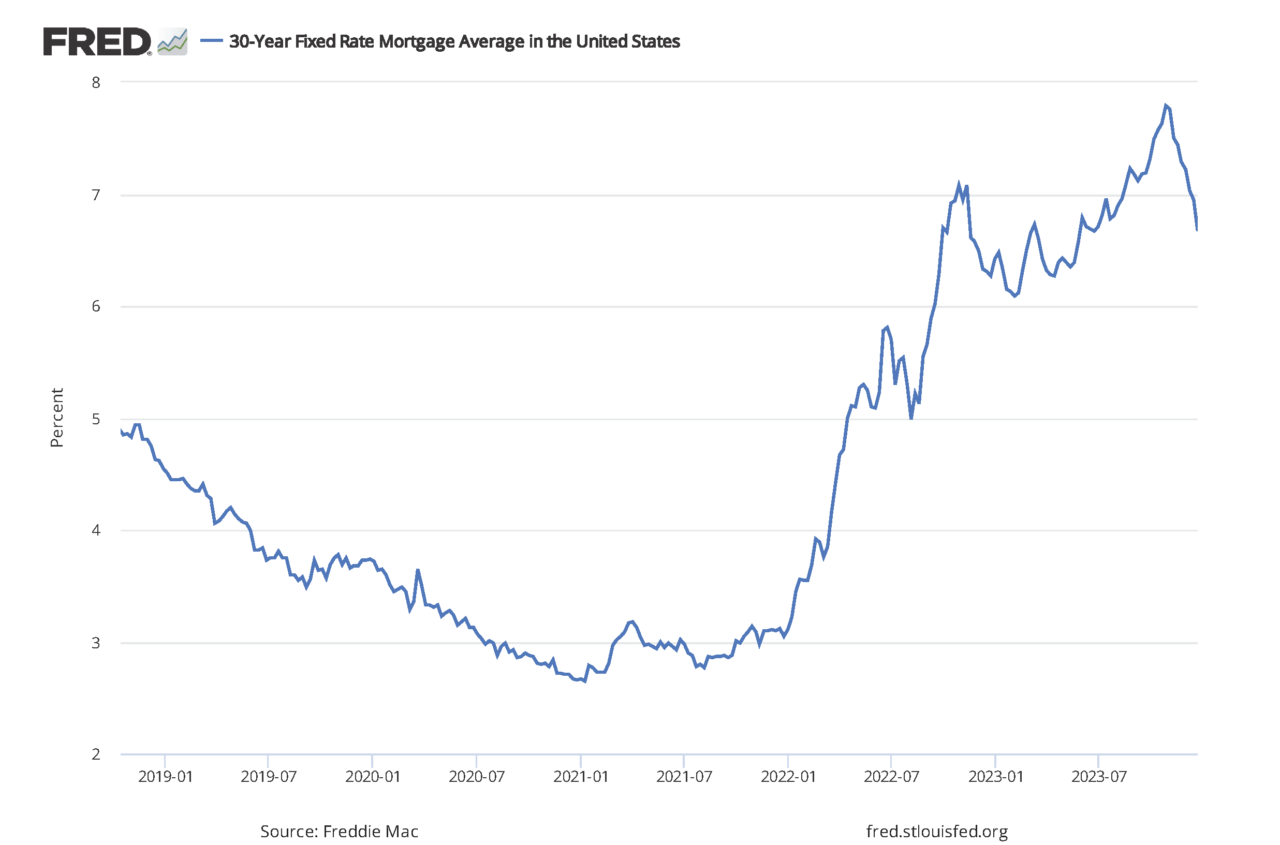
Interest rates were super low two years ago, which proved to be a mixed bag for individuals. On the plus side, debt was cheap – a 30–year mortgage was about 3% – but on the downside, savers earned a pittance on their cash, and bond yields were slim.
Fast forward to the present, and the rate situation couldn’t be more different. Savings accounts now pay north of 4%, and bond yields are up (yay!), but debt is expensive, with mortgage loans hovering around 7% (boo!). Here’s a chart from the Federal Reserve showing the dramatic increase in the average rate for a 30-year mortgage.
FEDERAL RESERVE OF ST. LOUIS
What does 2024 have in store for us on the interest rate front? Will interest rates stay elevated or decline?
The consensus is that rates will decline in 2024 (e.g., see here and here). However, we should be cautious about relying on such forecasts because predicting future interest rates is fraught with difficulty. Even the Federal Reserve, with its team of hundreds of economics PhDs and access to every morsel of relevant economic data, hasn’t been great at predicting interest rates.
Four times a year, the Fed publishes the predictions of the 19 participants in the Fed’s Federal Open Market Committee (“FOMC”). These predictions are commonly displayed via a “Dot Plot,” where each dot represents a FOMC participant’s prediction of the Fed Funds Rate at the end of each calendar year. (The Fed Funds Rate is set by the FOMC and is the target interest rate that commercial banks use to borrow and lend reserves to each other and influences interest rates across the economy.) By examining past Dot Plots, we can evaluate the Fed’s success at predicting future interest rate levels.
Fed Dot Plots March 2021 – September 2022
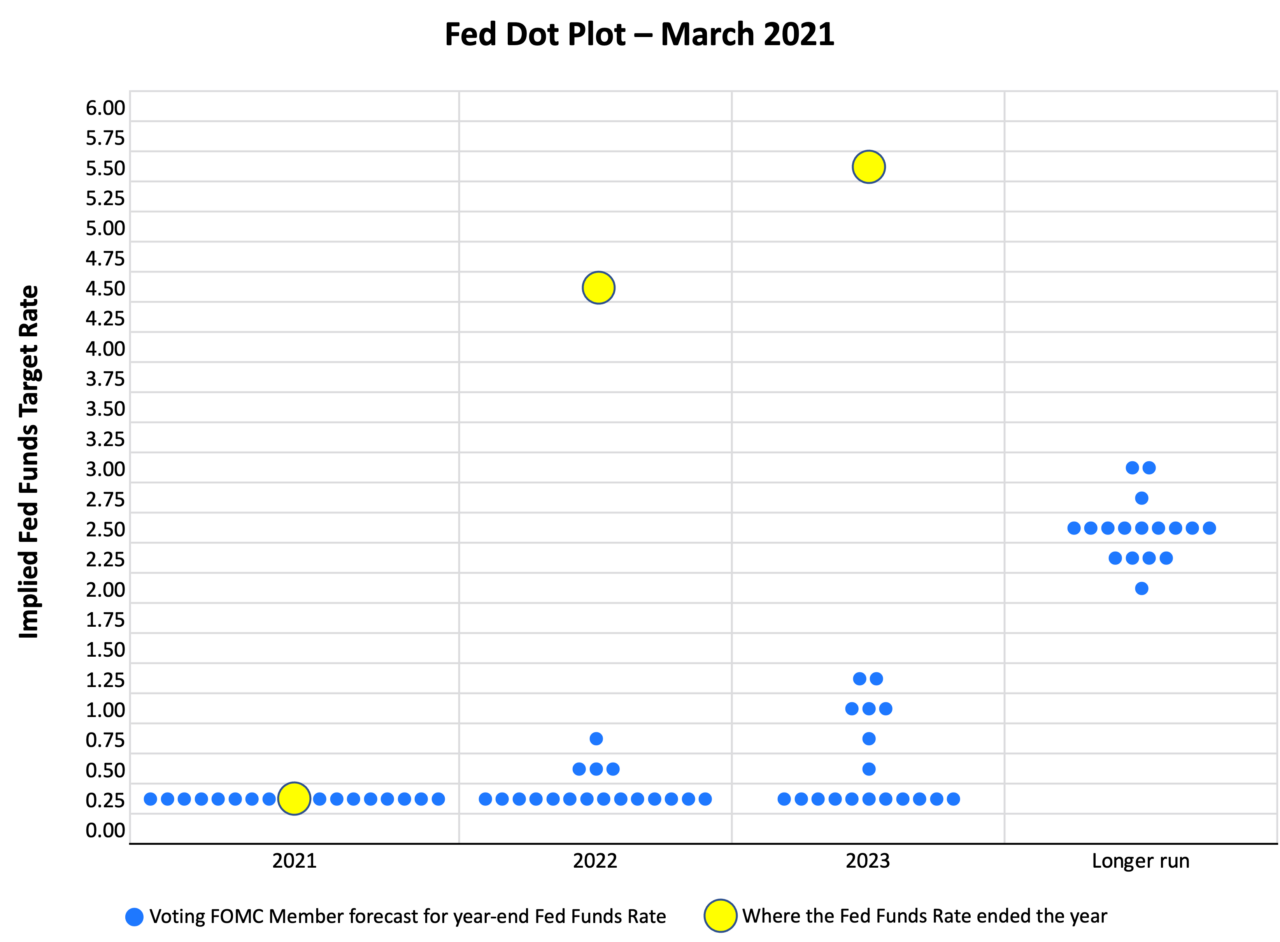
The first Dot Plot below is from March 2021. Recall what was happening then: COVID-19 vaccines were being rolled out, and the economy was growing at a healthy rate as it rebounded from 2020’s lockdowns. Inflation was increasing beyond the Fed’s target range, but at the time, Fed Chairman Jerome Powell said that inflation was transitory and didn’t expect that rate increases would be necessary to keep inflation in check. (Note: the Fed raises the “Fed Funds Rate” to slow the economy and tame inflation.)
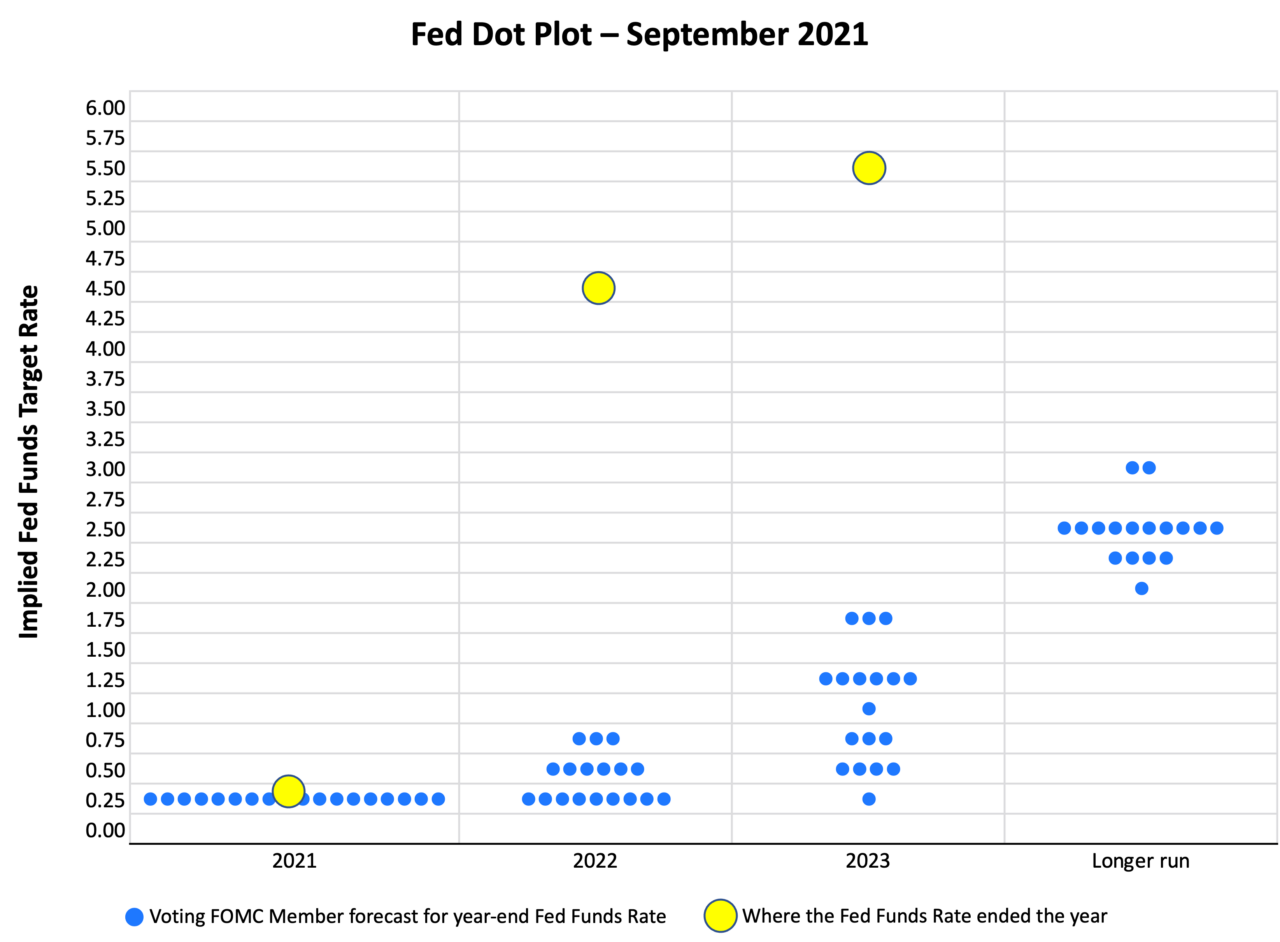
The blue dots represent the FOMC participants’ forecasts, and the yellow dots are where the Fed Funds Rate ended each year.
ST. LOUIS TRUST & FAMILY OFFICE – DATA FROM THE FEDERAL RESERVE
The above chart shows that the Fed was spot on with its rate forecast for year-end 2021, but the median forecaster was off by 4% for 2022 and by more than 5% for 2023, hugely underestimating what the Fed Funds Rate would be.
By September 2021, inflation was becoming a real problem, with August’s inflation number increasing to 5.3%. Yet, the FOMC still didn’t think significant rate increases would be needed in 2022 or 2023, as the Dot Plot for September 2021 below shows.
ST. LOUIS TRUST & FAMILY OFFICE – DATA FROM THE FEDERAL RESERVE
A few months later, with inflation running at nearly 7%, Chairman Powell ditched the transitory description of inflation.
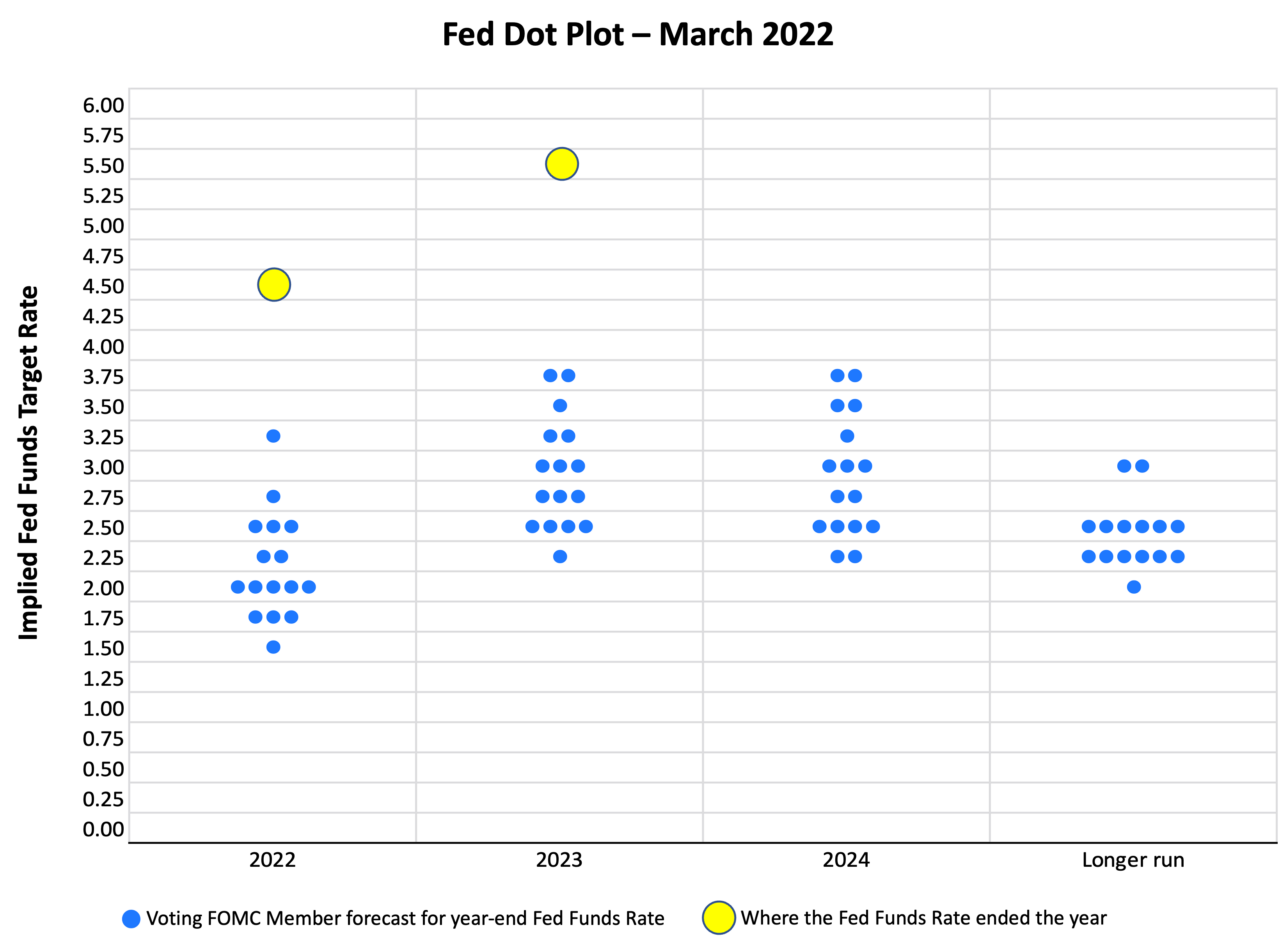
By the March 2022 Fed meeting, inflation was running at 8%, the highest rate in 40 years. At that meeting, the Fed increased the Fed Funds Rate by 0.25%, the first hike since before the pandemic, and the first of eleven rate hikes that would increase the Fed Funds rate by 5% over the next sixteen months. Here’s the Dot Plot from that March 2022 Meeting:
ST. LOUIS TRUST & FAMILY OFFICE – DATA FROM THE FEDERAL RESERVE
You can see that the FOMC members realized that steeper rate hikes would be necessary but still massively underestimated how high rates would need to go to quell inflation.
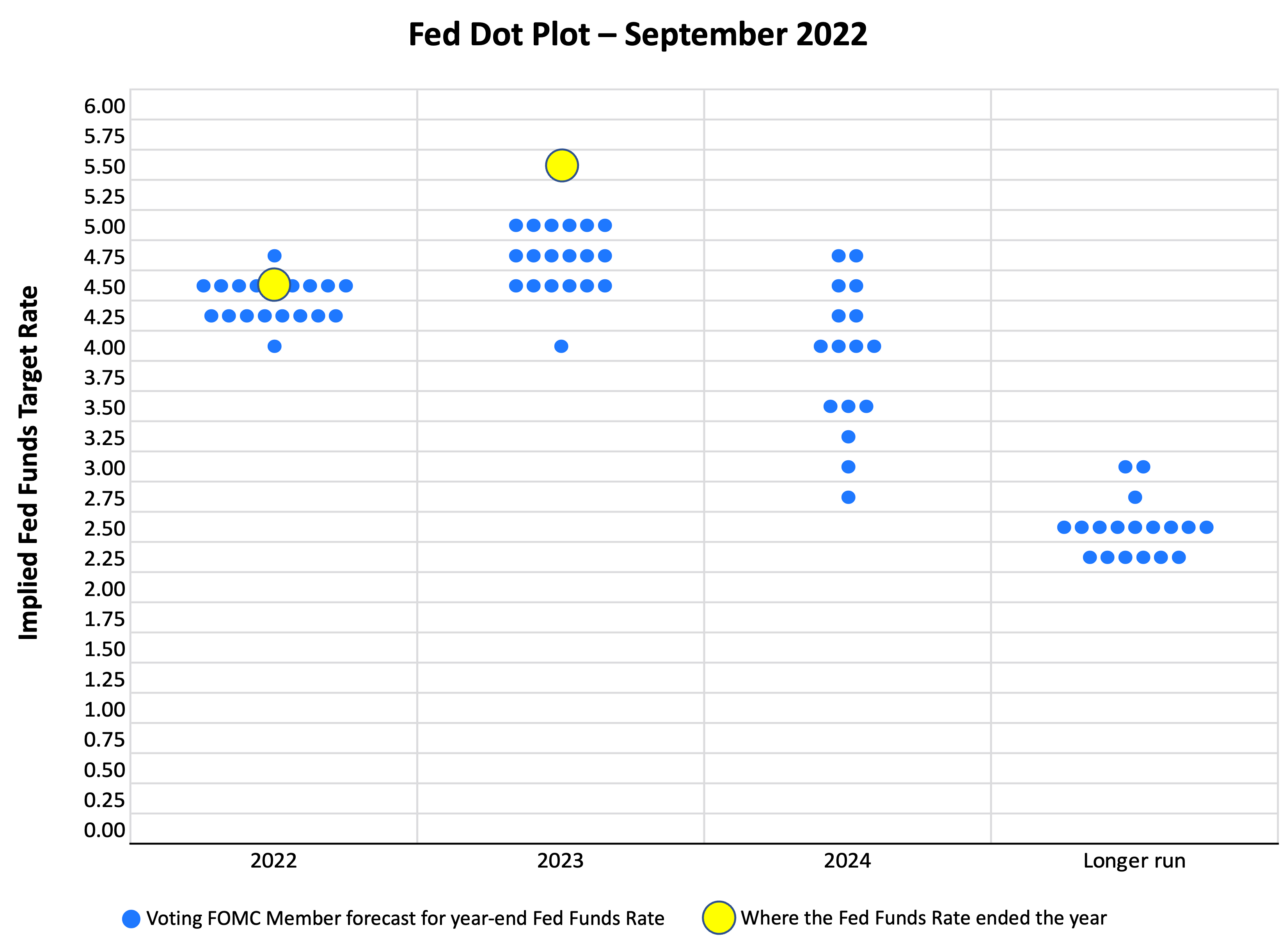
It wasn’t until September 2022, with inflation having peaked at 9.1% three months earlier and still running at over 8%, that Fed guidance for 2022 and 2023 rates came close to what year-end rates were.
ST. LOUIS TRUST & FAMILY OFFICE – DATA FROM THE FEDERAL RESERVE
What The Dot Plots Teach Us
I highlight the Fed’s failings at predicting interest rates not to criticize – the Fed is doing the best job it can. Rather, my point is that we should create a mental model that predicting rates is a fool’s errand. If the Fed, with all its resources, can’t do it well, what are the chances that we, our financial advisor, banker, or talking head on CNBC, will do a better job?
I know this message isn’t as fun as me predicting what rates will do next year, saying something like, “The 30-year mortgage will drop to 5% by the summer,” or “the 10-year treasury will be at 3.5% in the spring.” But nobody knows. It’s best to structure our investments and our choices about debt and spending as if we don’t know. Because we don’t.
Here’s how I put it in my book The Uncertainty Solution: How to Invest with Confidence in the Face of the Unknown: “Using market predictions to inform investment decisions is like preparing your boat to go to sea based on weather forecasts that someone made up. Either you’ll be unprepared for a storm or weighed down with life rafts and safety gear when you could be fair-weather sailing. It would be better to prepare your boat well for both storms and fine weather. That’s how it is with investing.”


