The biggest professional football game of the season will be played this Sunday. It’s time for the Super Bowl! The Super Bowl is a rare occasion where the collective consciousness of America is singularly focused on one game. And not just the game itself, but the glitz, the spectacle, the storylines, the commercials, the celebrity attendees (you know who I am referring to). Plus, this massive event has tremendous influence outside the game itself.
This begs a fun question: Does the outcome of the Super Bowl affect the markets?
You may chuckle at this notion, but back in 1978, a New York Times sports journalist first introduced the “Super Bowl Indicator” (SBI) theory that a Super Bowl win for a National Football Conference (NFC) team predicts a rise in the market for the year, while a win for the team in the American Football Conference (AFC) foretells a decline in the market. At the time of the indicator’s origin, it was correct over the 12 Super Bowls played to that point. Fascination with the Super Bowl Indicator grew decades later around the dot-com bubble when its accuracy remained at a resiliently high 84% since inception.
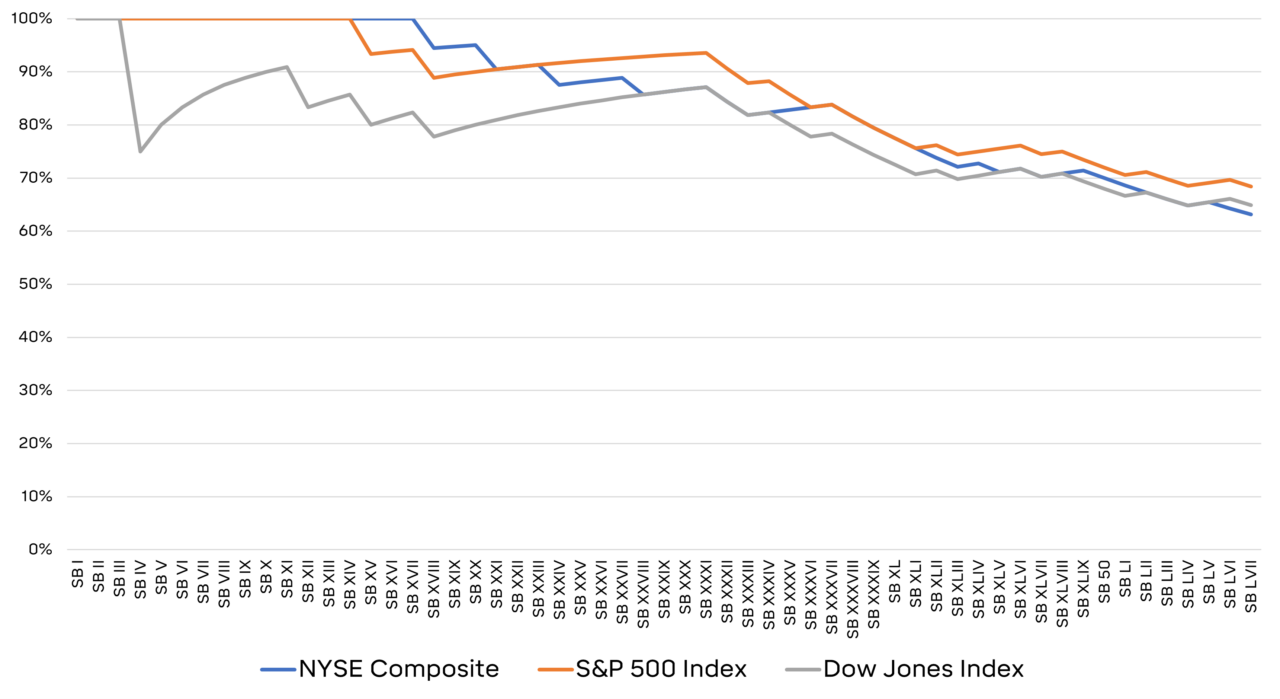
At the SBI creation, the NYSE Composite Index was the proxy for the “market.” The chart below shows the cumulative accuracy of the indicator throughout the history of Super Bowls with the addition of the S&P 500 Index and Dow Jones Industrial indexes for comparison purposes.
Cumulative Accuracy of the Super Bowl Indicator by Market Proxy
1966-2023

Looking back as we approach Super Bowl 58 (or LVIII), the SBI has delivered a mixed but still compelling picture of market prediction when viewed cumulatively.
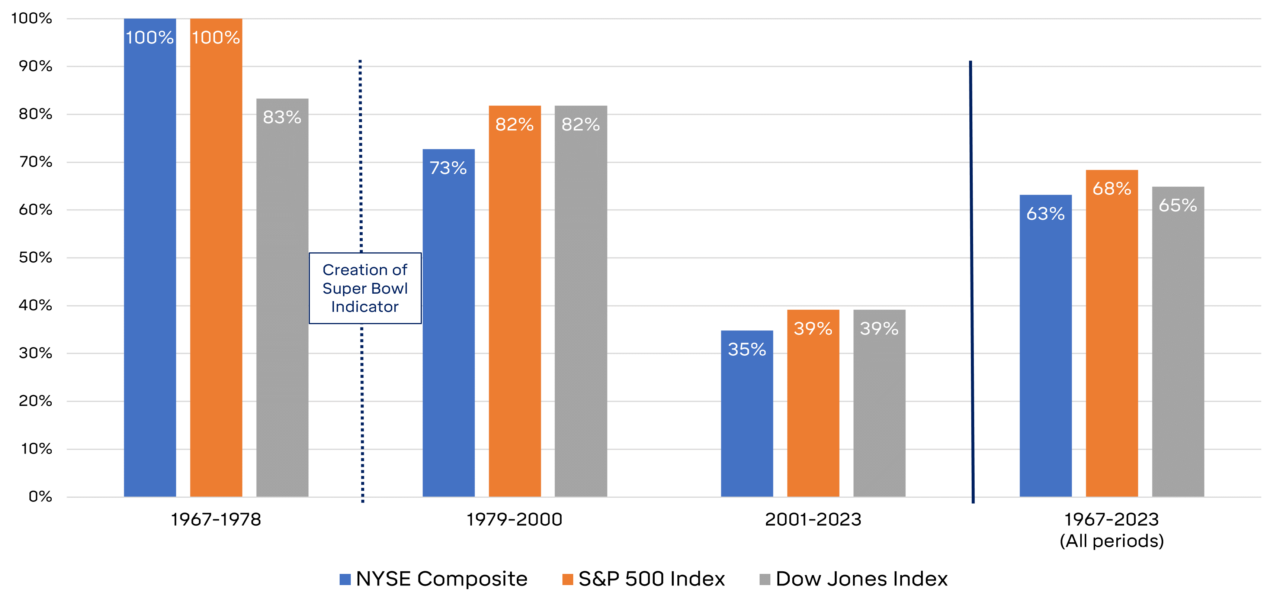
In investments, we rely heavily on statistical analysis to evaluate the merits of strategies and products. Just because variables are statistically linked (implying a correlation) doesn’t mean a cause-and-effect relationship (e.g. causation) is associated with them. All sorts of things can be data mined and shown to have statistical relationships. In 1978, it seemed plausible there was a causal relationship for the SBI given its 100% accuracy at the time. But as the sample size grew, it became more evident that what seemed a causal relationship turned out to be just unrelated variables (in statistics, this is referred to as a “spurious correlation’). Breaking down the indicator’s accuracy by distinct periods highlights the unraveling of the purported relationship.
Cumulative Accuracy of the Super Bowl Indicator During Distinct Time Periods

Should the SBI be used as a signal for investing? No. The SBI only seems valuable due to data mining and our susceptibility to confuse correlation with causation. These points were highlighted in a 2001 written exchange between the Super Bowl Indicator’s author and WSJ reporter Jason Zweig, where the author reflects on the absurdity of an indicator he created.
When it comes to a game’s outcome and the fate of the entire stock market, don’t take it seriously, as it was never intended to be serious. But it does have entertainment value, and isn’t that what the Super Bowl is all about?


