Which is better, investing in a fund where the manager uses their expertise, skill, and judgment to try and beat the market (i.e., an “active manager”) or just buying an index fund that delivers the market return (“passive investing”)? This active/passive debate has been raging for decades, and the conclusion from the data is that (1) most active managers underperform after fees, but (2) a small portion of managers outperform over the long term. Does it make sense to find a manager who possesses skill and can assemble a portfolio that will outperform the market in the long run? Maybe, but before deciding how much, if any, of your portfolio should be invested with active managers, it’s essential to know the odds of outperformance.
S&P, the company behind the iconic and widely-tracked S&P 500 Index (among other indices), maintains scorecards that compare the net-of-fee performance of active managers against their benchmarks over different time horizons. The SPIVA (S&P Indices Versus Active) scorecard report shows the proportion of actively managed funds across different style categories underperforming their benchmarks over a given investment horizon.
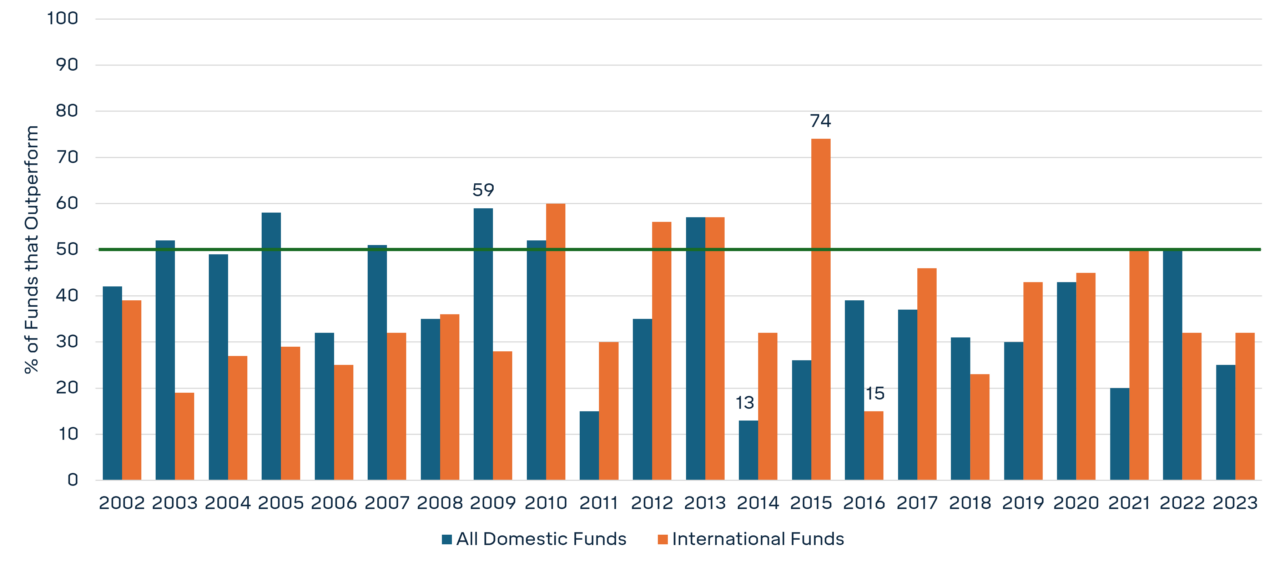
The results of the SPIVA U.S. year-end 2023 edition (found here) illustrate the long odds of active manager outperformance. On a calendar year basis, active management outperformance varies yearly but is generally worse than a coin flip (marked by the 50% line in the chart below). The chart shows this history going back 20 years for Domestic and International Funds measured in S&P’s database.
Percentage of Funds that Outperform their Respective Benchmarks
By Calendar Year (2002-2023)

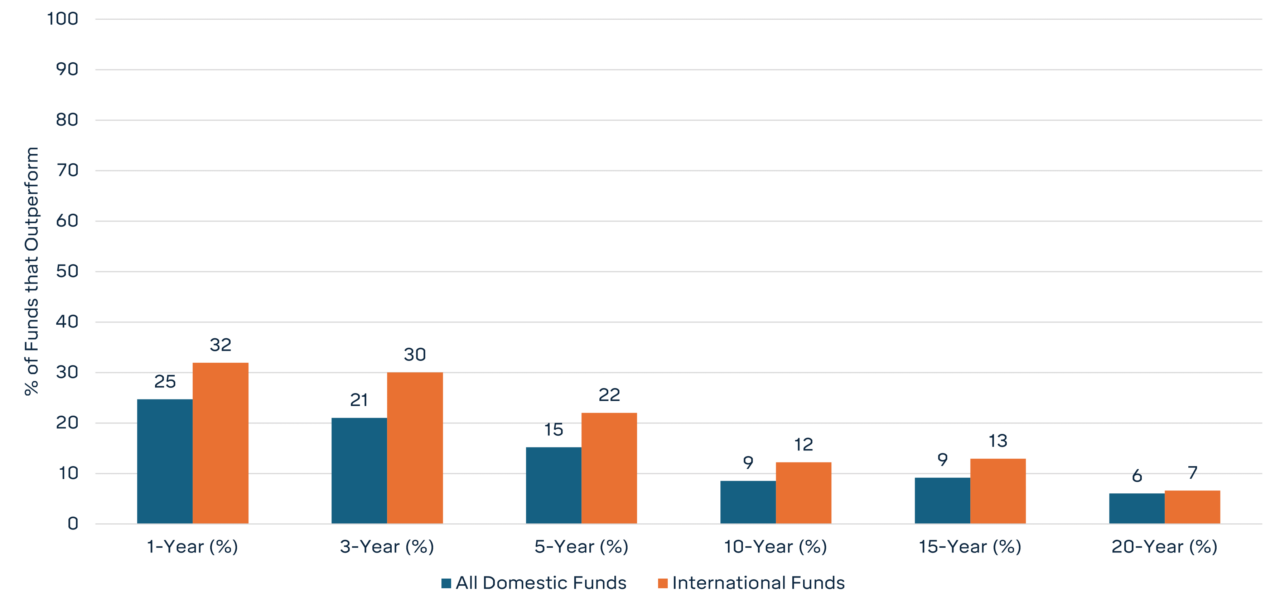
The longer-term analysis of active outperformance is more sobering. As time horizons lengthen, the proportion of manager underperformance rises. The chart below shows the same dataset as measured over various backward-looking time horizons.
Percentage of Funds that Outperform their Respective Benchmarks

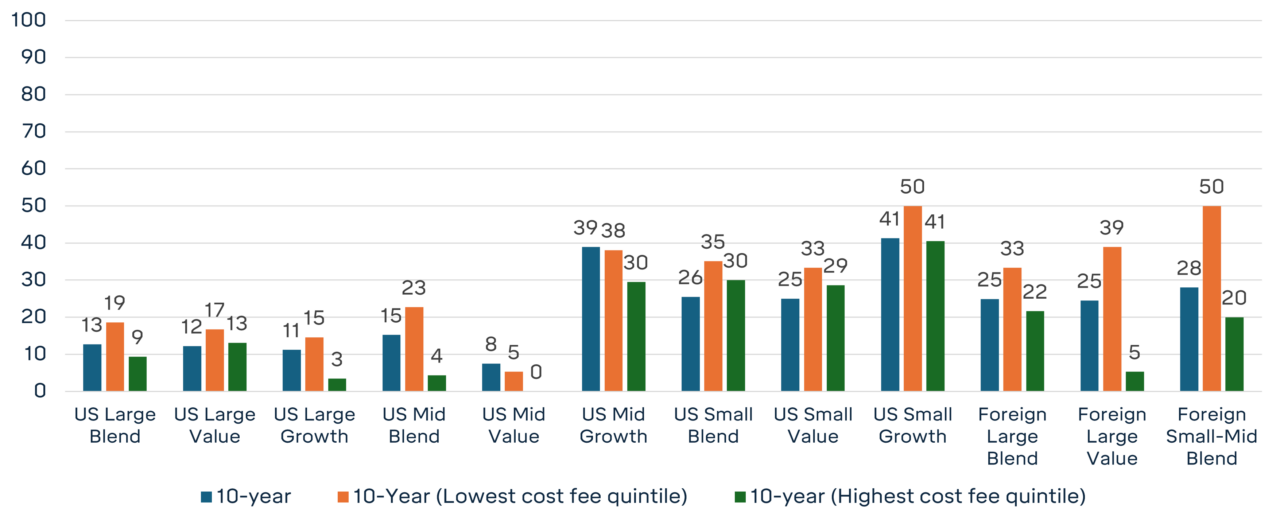
The story SPIVA tells suggests that investing with an active manager is a loser’s game. Yet, one specific manager variable improved the odds of outperformance across almost all categories. A study by Morningstar found that the active managers in the lowest quintile of fees had a higher rate of outperformance, and those in the highest quintile had worse odds. This makes sense, as active management fees, which can be over 1% in many cases, are detractors of performance and something the benchmark doesn’t have to overcome.
In the chart below, you can see that managers in the lowest quintile (orange bars) tend to have greater outperformance than the highest quintile (green bars) or all managers combined (blue bars).
Active Funds’ Success Rate by Category (%)
Measured over a 10-year Horizon

What does this mean for investors? First, if you are going to invest with an active manager, be wary of the odds against the manager outperforming. Second, pay attention to the fees, as picking lower-fee managers will increase your odds of success.


