A primary investing axiom is that risk and return are related – you must take on more risk to achieve higher returns. Risk has different definitions in different contexts (for great reads about risk, check out Howard Marks’ memos on Risk and Risk Revisited), but the risk that investors are chiefly concerned about is losing some or all of their investment. However, in the investment realm, volatility, which is a statistical measure of the dispersion of returns of an investment, is used as a proxy for risk. Higher volatility means an investment’s value is spread out over a larger range of values.
Investors care about realizing a loss of value (risk), but should investors care about the path or variation of prices along the way (volatility)? Yes.
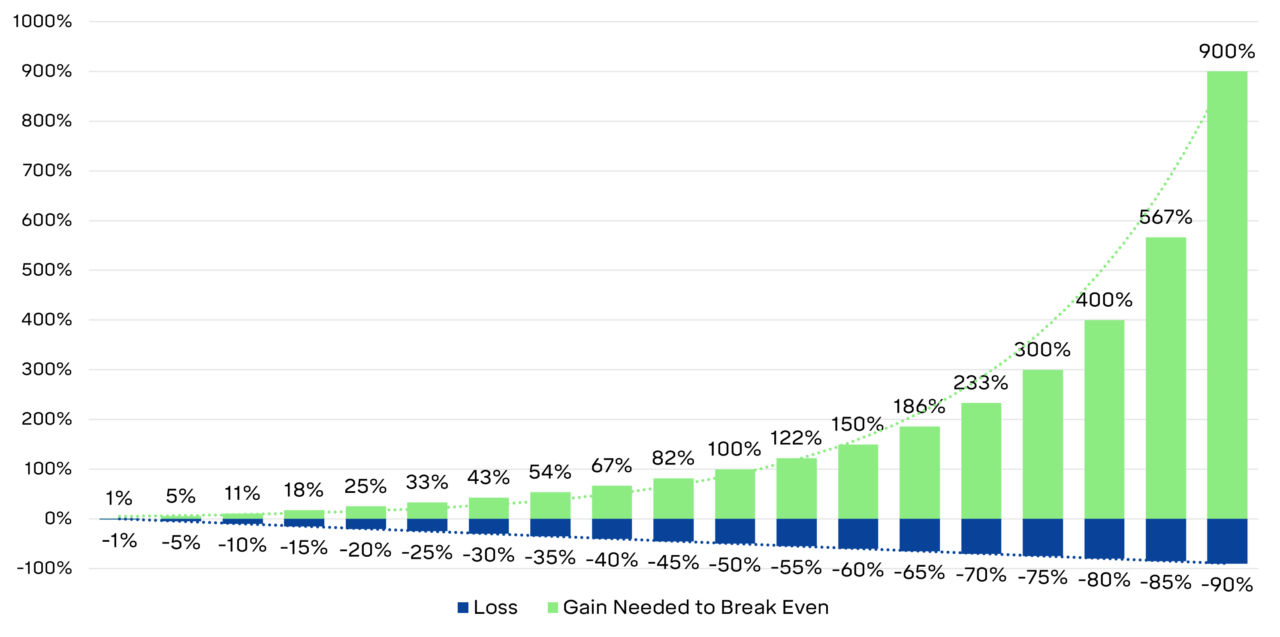
The mathematical relationship between losses and the gains needed to recoup those losses reveals a direct link between volatility and risk. Investments with greater volatility typically experience more significant losses than less volatile ones (as well as bigger gains), so the gains needed to recoup those greater losses must be larger to get back to even. Below is a chart showing the math of recouping losses. While the losses grow linearly, the gains needed to break even rise exponentially.
The Math of Recouping Losses

For example, a stock that experiences a 10% decline needs to go up 11% to recoup its loss. If the stock is more volatile and has a 25% drawdown, the gain to get back to zero climbs to 33%, and a 50% loss requires a 100% gain. Thus, it becomes harder to get back to even the further down you go. (But not impossible, a prime example being that Amazon stock saw a near -95%(!) stock decline at the end of the dot-com bubble and needed around a 1900% gain to recoup that loss – which it did about a decade later. Compare that with Citigroup, which saw a 98% decline during the great financial crisis and still sits about 90% lower than its prior all-time high.)
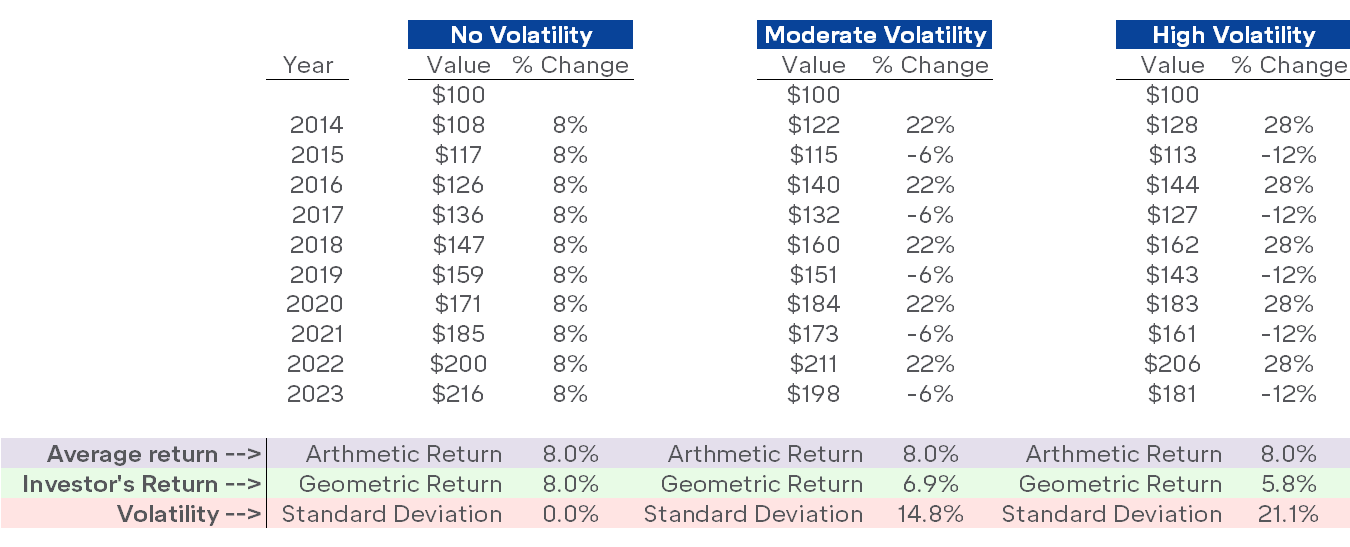
Volatility also impacts the compounding of investment returns. The best way to understand this is to know the difference between the arithmetic return (simple average) and the geometric return (compound return). The difference between the two is what’s known as the “volatility drag,” which means that compound returns are “dragged down” by high levels of volatility.
The example below shows three portfolios with the same beginning value but different levels of volatility (as measured by standard deviation). While all the portfolios have the same arithmetic return of 8%, the geometric returns (and ending values) are lower for the more volatile portfolios.
Volatility’s Effect on Returns

This means that reducing portfolio volatility, which is accomplished primarily through diversification, enhances returns. That’s why owning bonds and different types of stocks beyond just the volatile high-flyers makes sense from a long-term return standpoint. This is especially important to remember during times like the present when the highly volatile tech sector is marching higher, leaving you questioning why you own anything else.


